


CHART and QTc
Introduction
The Cardio-HART (CHART) system assesses the QT interval as part of a comprehensive 12-lead ECG interpretation. CHART is specifically designed to provide a detailed evaluation of QT interval severity. This includes distinguishing between borderline cases and cases with prolonged or shortened QTc, with additional support provided through multiple QTc measurements.
The CHART report displays both QT findings and QTc measurements, as outlined in the subsequent subsection.
In contrast to traditional approaches, that rely solely on age and gender for normalization, CHART employs individual normalization using body size indexes of bio-signals. This innovative approach, implemented in the new corrected QT interval (QTc-CHART), considers multiple parameters beyond heart rate alone. As a result, QTc-CHART demonstrates reduced bias across various patient subgroups. Further details are provided in the following subsection.
QT evaluation in the CHART report
In the CHART report there are more QT measurements:
- Findings:
o Long QT interval
o Borderline long QT interval
o Short QT interval
o Borderline Short QT interval
o Uninterpretable QT interval
- Supported Measurements
o QT interval – raw interval measurement, not normalized
o JTc interval – which provide measurements independently from QRS interval. In cases of a wide QRS interval, the JTc interval is classified, as shown in the example figures.
o QTc (Fram) – Framingham formulae for QTc – as the best well known QTc.
o QTc (CHART) – Individually normalized QT interval by CHART – the new, ultimate QTc interpretation
Prolonged QTc measurement is part of ECG-based Heart Failure probability score (it is contributed as zero in case of Short or normal QT).
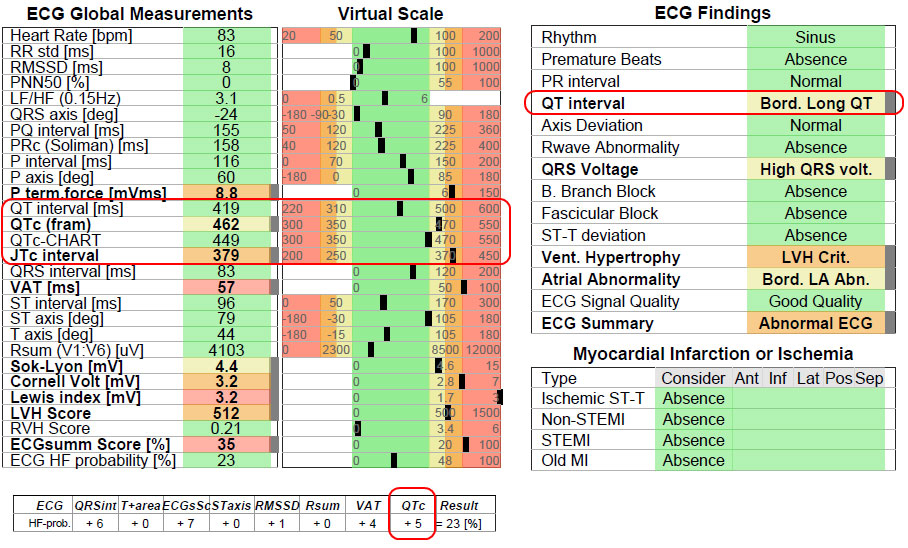
Figure 1 – Example of Borderline Long QT interval
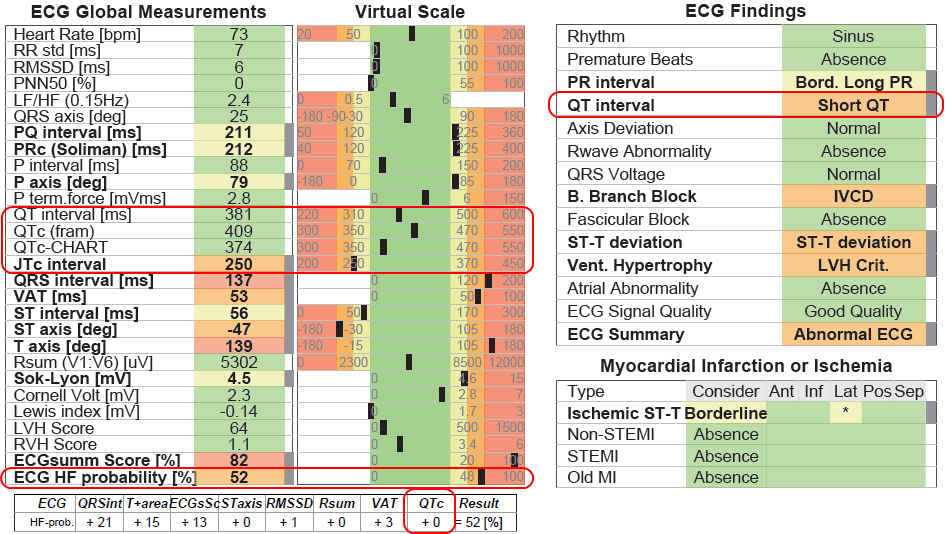
Figure 2 – Example of Short QT interval
QT interval measurement
The QT interval is the time from the start of the Q wave to the end of the T wave. It represents the time taken for ventricular depolarization and repolarization, effectively marking the period of ventricular systole from ventricular isovolumetric contraction to isovolumetric relaxation.
The end of T wave is defined by the maximum slope intercept method, see the following image[1]:
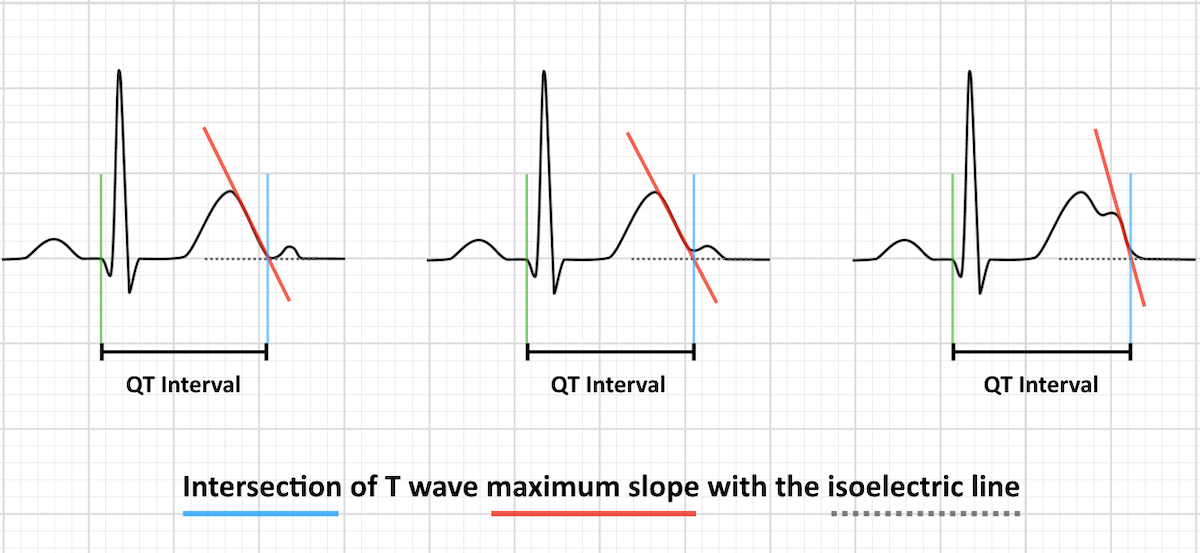
CPA does not define normal value for QT interval, only for the corrected QT interval (QTc) which estimates the QT interval at a standard heart rate of 60 bpm.
However, the QT>470ms is considered as abnormally long, but QT<470 is not always normal.
The segment measurements are defined globally for the typical beat. Therefore, the PQ interval is simply calculated as:
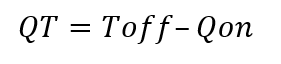
The ECG measurements page in CHART report shows how the automatic algorithm segment the ECG including T wave.
Figure 3 – Automatic ECG segmentation in CHART report (the horizontal line of T+ and T- shows the identified T-onset and T-end)
QTc-CHART
CPA utilizes the CHART multi-factor normalized QT interval. The current normalization is mitigating the bias of normal value between patient subgroups based on Age, Gender, Race, and Body Size. Consequently, the upper normal range is singular and independent of age, gender, and race.
The normal value of QTc is between 350ms+ and 450ms+ for man and woman.
- The QTc-CHART > 450ms+ considered as Prolonged QT interval.
- The QTc-CHART < 350ms+ considered as Shortened QT interval.
The QTc-CHART is a multi-factor normalized QT interval. The weight parameters are tuned to reduce the bias between patient subgroups. These following subgroup parameters used in bias analysis:
- HR-mean with 4 quantiles: -63, 63-69, 69-76, 76+ [bpm]
- Gender: MALE and FEMALE
- Race: Caucasian or Asian and African American
- Age with 4 quantiles: -41, 41-56, 56-66, 66+ [year]
- Height with 4 quantiles: -162, 162-168, 168-176, 176+ [cm]
- Weight with 4 quantiles: -65, 65-75, 75-86, 86+ [kg]
- CBSI with 4 quantiles: -2.24, 2.24-2.33, 2.33-2.42, 2.42+ [m+1/5kg^0.27]
The next figure shows the bias of various QTc calculated based on these demographic parameters. The smaller bias rate means better normalization capability. 2191 patient records were included in this statistical report, which have normal ECG and heart rate.
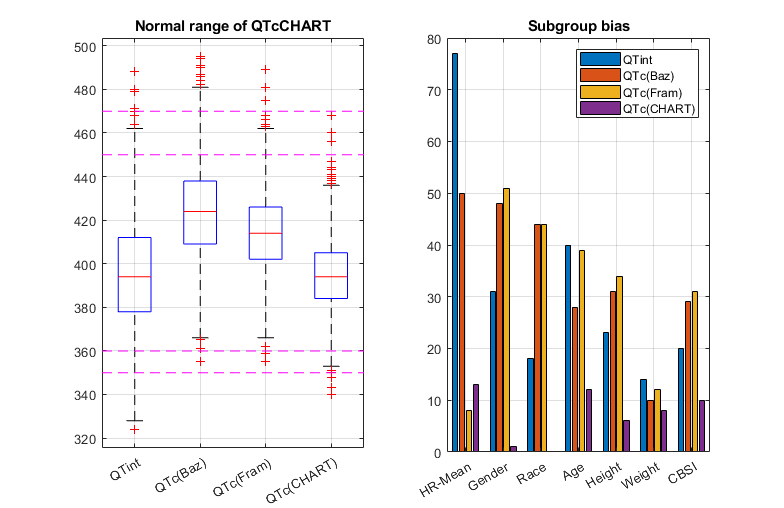
Figure 4 – Represent how QTc(CHART) reduces the subgroup bias compared to QT interval and other QTc formulas: Bazett (Baz) and Framingham (Fram)
The QTc(CHART) formulae is following:

isFemale – is “1” in case of Gender = Female, “0” in case of Gender = Male
isAfrAm – is “1” in case of Race = African American, “0” Race otherwise

Written by Dr. Istvan Kecskes, 2024-04-23
Note: this article is produced to provide explanation on issues of interest. The information provided is deemed correct at time of writing, but is subject to change without notice or warning.
[1] https://litfl.com/qt-interval-ecg-library/