“CHART provides clinical data about a patient’s cardiac status that is not only of diagnostic interest, but also guides the practitioner in deciding whether to refer the patient to the cardiologist, and provides the cardiologist with relevant information to guide clinical decisions about testing and treatment.” Dr. Steven Kurtzman, MD FDA Cardiologist
Patients visit their family physicians for reasons far removed from Cardiovascular Disease (CVD), each visit an opportunity to address this critical issue.
But missed opportunities are the rule and patients can go for years without any idea they are at risk.
Although family physicians have more frequent and direct contact with patients than cardiologists, they are armed only with personalized risk assessments and ECG devices for screening for onset of CVD. But ECG has serious limitations.
ECG’s limitations and the lack of technological innovation, has given rise to one of the most intractable problems in Primary Care: “...knowing when to refer a patient to cardiology!”
Failure to detect onset of CVD, means patients either fail to receive timely treatment or are referred to cardiology too late and this... “usually when symptoms are obvious by which time there is little that can be done for them”.
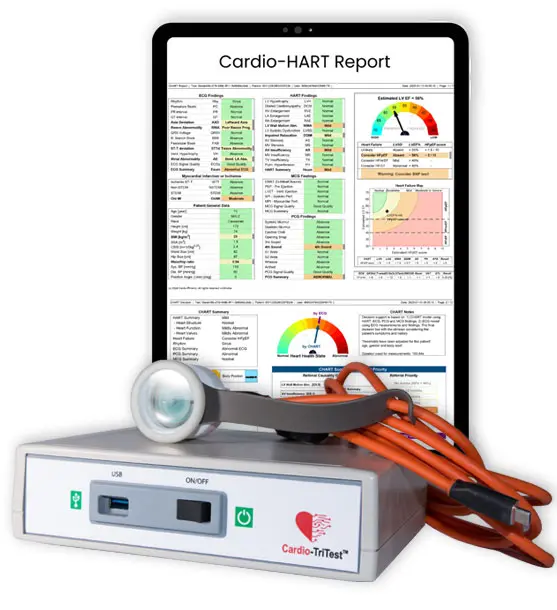
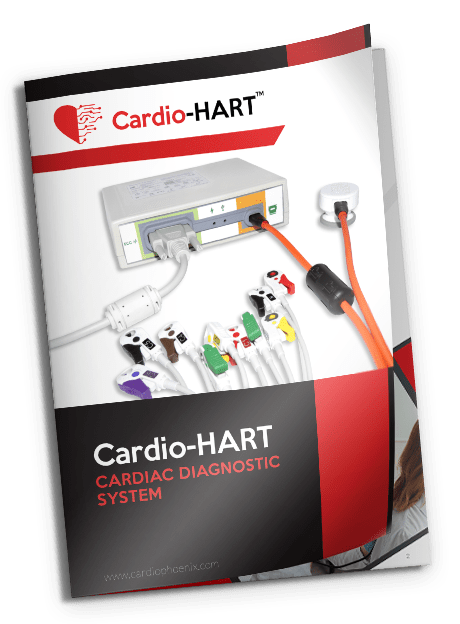
CHART is a Breakthrough Technology that arrives just-in-time to give Health Care Providers (HCP) the most effective cardiac diagnostic device for use in Primary and ambulatory Care settings, including Telehealth.
CHART makes use of novel bio-signals, to complement and augment ECG’s electrical signals, with acoustic and physiological bio-signals, this gives CHART it’s unique ability to understand the morphological and functional aspects of the heart.
CHART is a combination of the best of ECG, ECHO and Auscultation enhanced with AI-powered analysis.
As a result, CHART is able to detect and diagnose 95%1 of all significant and common heart diseases.
Compare that to ECG, at only 44%1.
It is a magnitude of difference in effectiveness, the likes of which will transform heart care, starting in Primary Care.
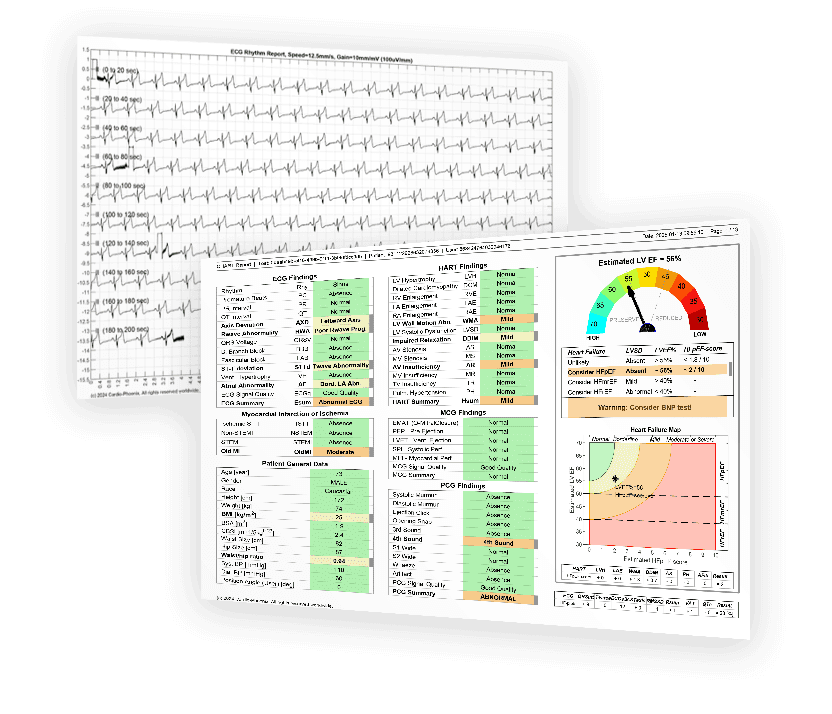
7 Major ECHO disease groups: LV, AE, DD, SD, TR, AMR, AMS;
14 critical HART[1] (ECHO) findings: LVH, DCM, RVE, LAE, RAE, Ischemic WM, LVSD, LVDD, AS, MS, AR, MR, TR, TR w/PH, and more..
22 common and significant ECG findings: MI, ST-T dev, LVH, RVH, AF, AFlut, ST, SB, IVCD, Long PR, Long QT, LBBB, RBBB, LAFB, LAX, RAX, PVC, PAC, and more...
many PCG and MCG findings: Murmurs, Systolic & diastolic, S1, S2, S3, S4 (heart sounds), EMAT, PEP, SPI, LVET, S1-Wide, and more...
It has been estimated it could reduce an additional 40 000 major CVD events and 156 000 deaths annually among the US adult population ≥40 years of age.
Dr. Alberto M, Verona, Italy, Aug 2020.
It is essential that patients suspected or confirmed of COVID-19 be screened for pre-existing cardiac conditions, as they are at higher risk of COVID-19.
However, most heart diseases that result from COVID-19 are more effectively diagnosable via Echocardiography, rather than ECG.
But Echo is not a front-line screening tool, and in a pandemic, Echocardiography services are in short supply, and might not be available.
CHART combines the best of Echo, ECG and Auscultation, providing critical point-of-care screening. CHART helps bridge the diagnostic gap between ECG and Echo allowing more timely and accurate life-saving patient management decisions.
CHART’s unique capabilities make it a game changer, now mid-pandemic, and long into the future to tackle COVID-19’s legacy heart disease in the post-pandemic recovery.
With the pandemic, Cardiac-Telemedicine proved a good solution to a chronic shortage of cardiologists and echocardiography services, forcing clinicians and patients alike to see the benefits of remote diagnostics.
For smaller and remote clinics, where staffing is minimal, CHART’s remote diagnostics fills a critical void.
In particular, CHART’s ability to remotely diagnose Covid-19 associated heart diseases that are typically diagnosable only via Echocardiography.
It also limits the number of HCP’s that can come into direct contact with the patient.
Collateral Damage and Safe Testing Sites.
Covid-19 deaths were surpassed by collateral cardiac deaths unrelated to COVID-19, as patients avoided medical facilities fearing Covid-19.
CHART can help create effective “Safe-testing” sites, that will help patients avoid Covid-19 “hot-spots”.
CHART Cardiac-Telemedicine will help reduce collateral deaths, by providing safe access to advanced cardiac diagnostic services.
CHART reduced FN by 24% & FP by 14% (clinical investigations).
CHART reduced FN by 14% & FP by 9% (FDA clinical study).
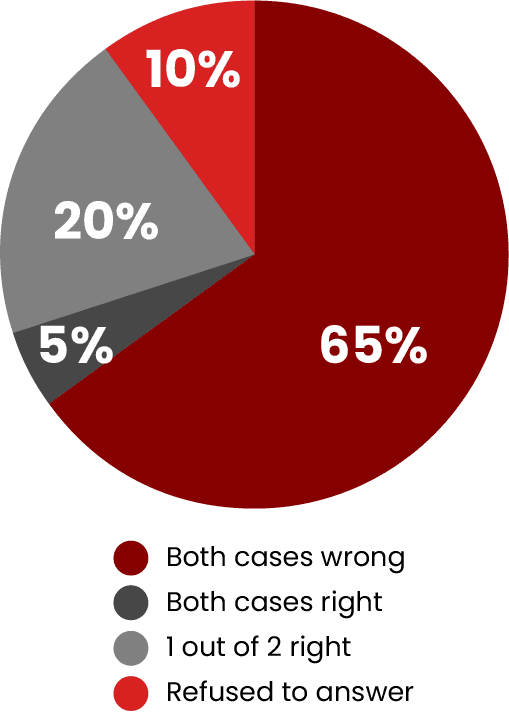
HCPs were shocked - they thought they knew their patients!
Diagnostic effectiveness by HCP´s using CHART, increased by over 250% compared to HCP using State-of-the-Art ECG devices.
Diagnostic indecision by HCP’s using CHART was only 4%, compared to HCP’s using ECG devices at over 40%.
HCP’s indicated they felt more professional as a result.
Using CHART, HCP’s showed only a 2% difference when compared to the Overreading Cardiologist’s results, but HCP’s using ECG devices, showed a 36% worse outcome - no surprise the Standard of Care requires Cardiologist Overread when ECG is used.
All 11 Cardiologists in the FDA study determined that CHART was 93.7% in agreement with their Echocardiography results.
Although the essential function of CHART is in guiding HCP’s in deciding when to refer their patient to the cardiologist, it also plays a critical role with cardiologists, as...
CHART provides the cardiologist with relevant information about the patient’s condition to guide clinical decisions about testing and treatment.
CHART enables a collaborative triage between cardiologist and the HCP.
CHART creates a “better patient” based on acceptable medical justification that supports the referral to the cardiologist.
CHART provides a start-point for echocardiography that can eliminate “cold-start” diagnosis situations, when the referral reason was not indicated. In clinical use, it was shown to reduce echo examination times by ~ 10 minutes. It adds up.
CHART can shift some of the burden into primary care, where cardiologist directed secondary treatments can be more effective and cost efficient.
As a silver tsunami of at-risk patients continues to grow putting increased pressure on a cardiology profession, many facing retirement, the secondary care sector is being stressed. Balancing patient care needs with Primary Care can help reduce cardiology wait times.
The root cause of cost in-efficiencies in heart care, can be traced to FPs and FNs.
FP means “healthy” patients are crowding cardiologists waiting rooms, undergoing tests they don’t need, that must still be paid for.
The heartbreak, is that FPs displace TP´s from timely access to care they need. Reducing FP’s leads directly to cost efficiencies, lower morbidity and reduced wait times.
FN means sick patients are sent home, inevitably to return but with higher morbidity, possibly by ambulance. Either way, more advanced care will be required, care that has far greater downstream costs that impact the healthcare system.
CHART is clinically proven to significantly reduced FP and FN.
Wait lists will shrink, access to care will improve, and downstream trauma care costs will be avoided.
Together, this leads to better quality of life, not only for the patient, but also for their families and for the healthcare system that must support them.